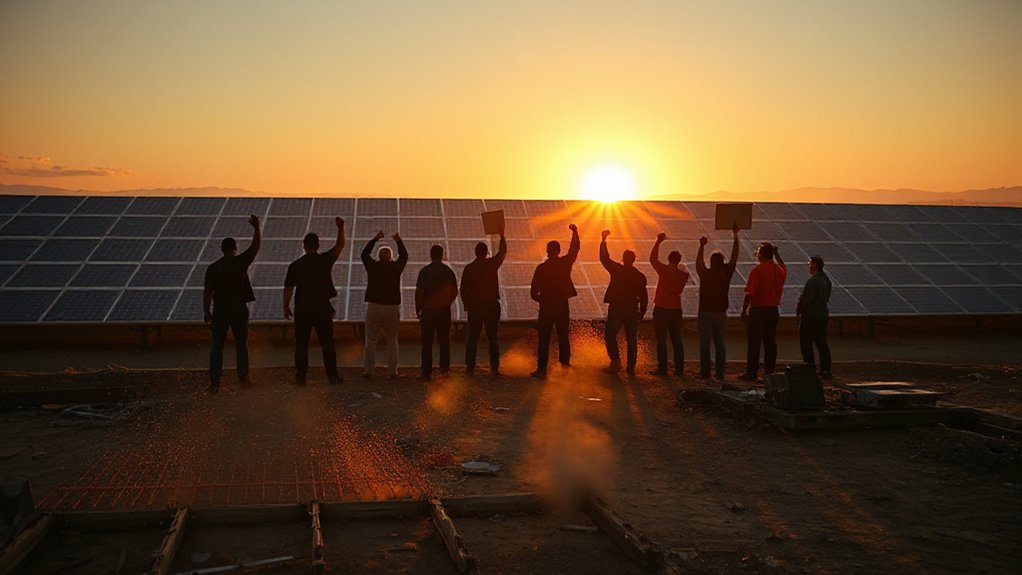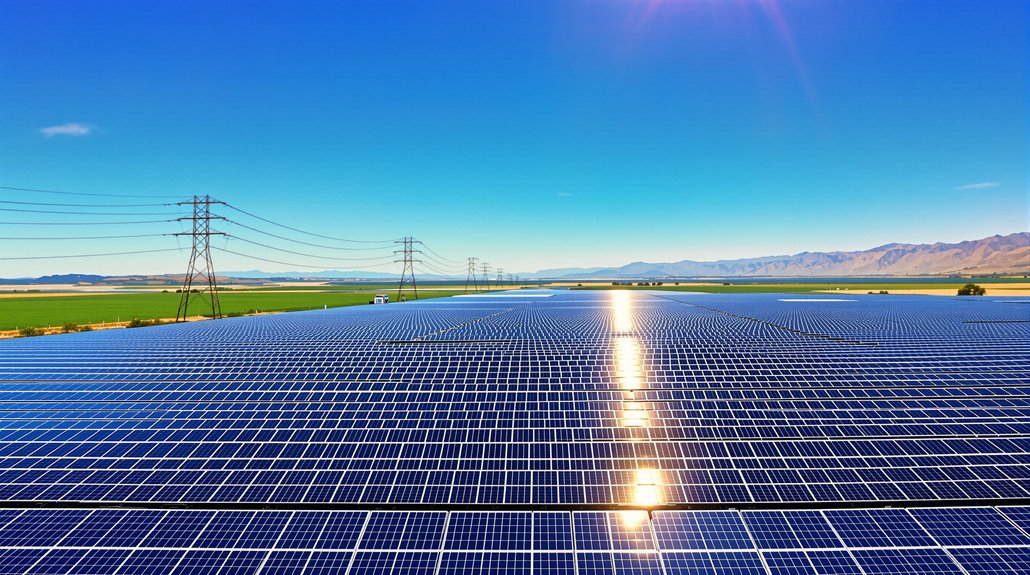
Sunshine dominates America’s power game. The solar industry installed a whopping 10.8 GWdc of capacity in Q1 2025, claiming 69% of all new electricity-generating capacity added to the US grid. That’s no small feat. It’s the fourth largest quarter in history, even with some market hiccups along the way.
Solar power isn’t just growing—it’s dominating the US energy landscape with record-breaking installations despite market challenges.
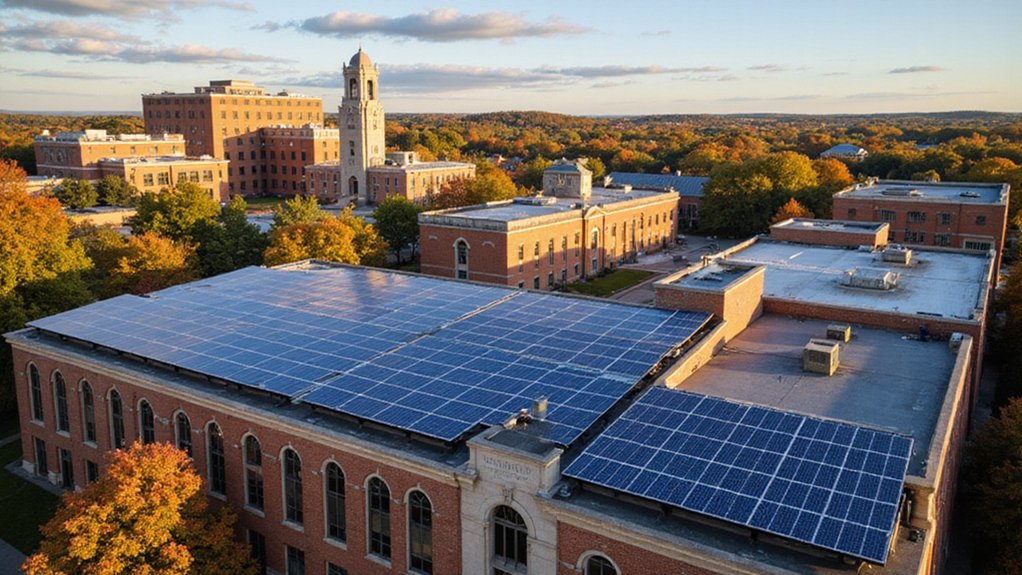
Five states are hogging all the glory. Texas, Florida, Ohio, Indiana, and California accounted for 65% of utility-scale installations, which reached 9 GWdc in Q1. Meanwhile, commercial solar grew by 4%, hitting 486 MWdc and outpacing other segments. California led that charge with over 200 MWdc added. Not too shabby.
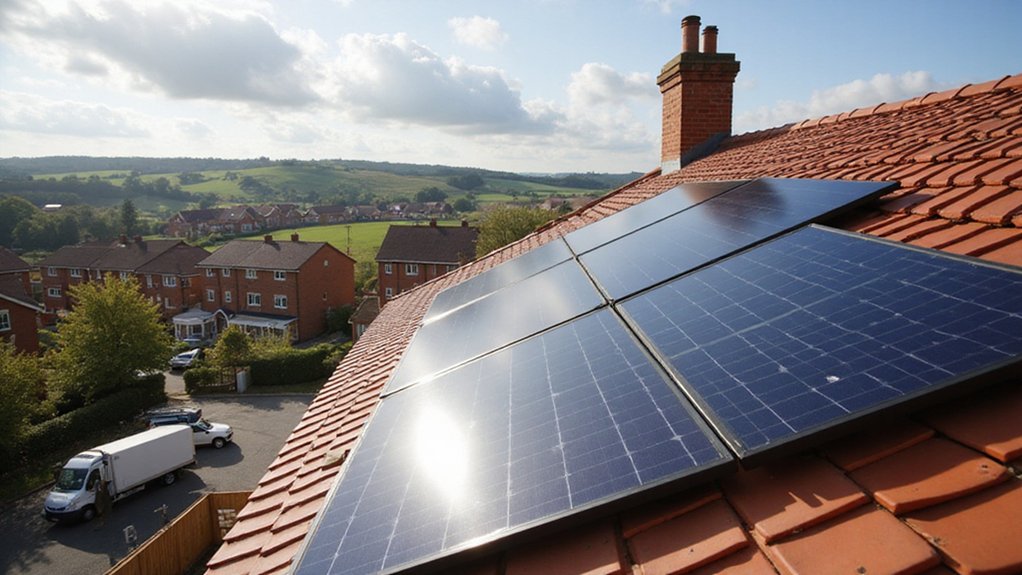
The residential sector? Not so hot. Installations dropped to 1,106 MWdc, the lowest since Q3 2021. Blame consumer hesitancy, economic uncertainty, and those pesky tariffs. People just aren’t putting panels on their roofs like they used to.
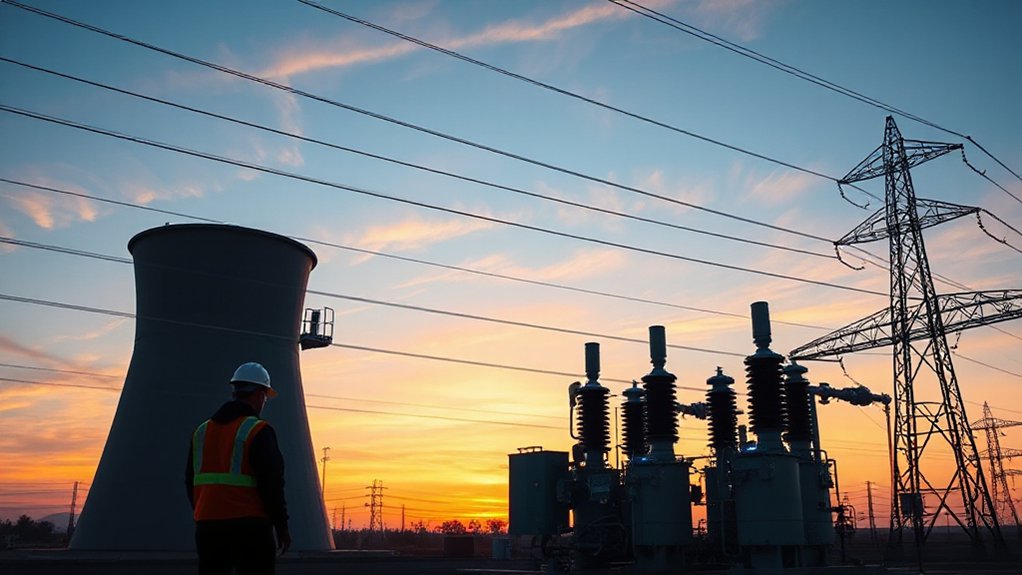
Still, the bigger picture looks sunny. A record 756,621 GWh of electricity came from solar and wind in 2024, powering over 70 million homes. That’s 17% of total US electricity generation, triple what it was in 2015. This transition has resulted in significant pollution reduction as the share of fossil fuels decreased from 67% in 2015 to 58% in 2024. Thirty states now get at least 10% of their electricity from these sources. Progress, people!
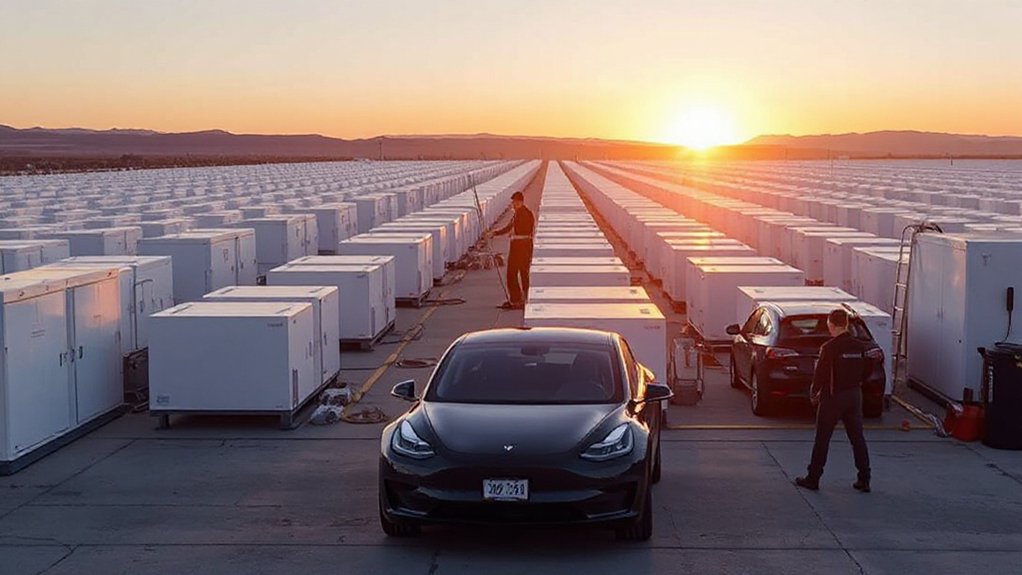
Manufacturing is ramping up too. Q1 2025 saw 8.6 GW of new solar module manufacturing capacity, the third-largest quarter on record. US module imports hit nearly 15.4 GW in Q3 2024. The supply chain’s getting stronger, despite those tariffs on crystalline silicon panels from Southeast Asia. Solar PV is continuing its remarkable trajectory as projections show it will account for half the increase in global electricity demand through 2027.
The economic impact? Massive. The industry has pulled in $70.3 billion in investment recently. Over 10,000 solar companies now operate nationwide, completing more than 5.5 million installations.
Globally, things look bright too. Installations are expected to increase by 10% to 655 GW in 2025, with steady growth projected through 2029. The five-year outlook projects nearly 43 GWdc annually through 2030, though tariffs and policy uncertainties could limit long-term growth. The solar transformation isn’t slowing down. It’s just getting started.
References
- https://seia.org/research-resources/solar-market-insight-report-q2-2025/
- https://www.climatecentral.org/climate-matters/solar-and-wind-2025
- https://seia.org/research-resources/us-solar-market-insight/
- https://www.energy.gov/eere/solar/quarterly-solar-industry-update
- https://www.solarpowereurope.org/insights/outlooks/global-market-outlook-for-solar-power-2025-2029/detail