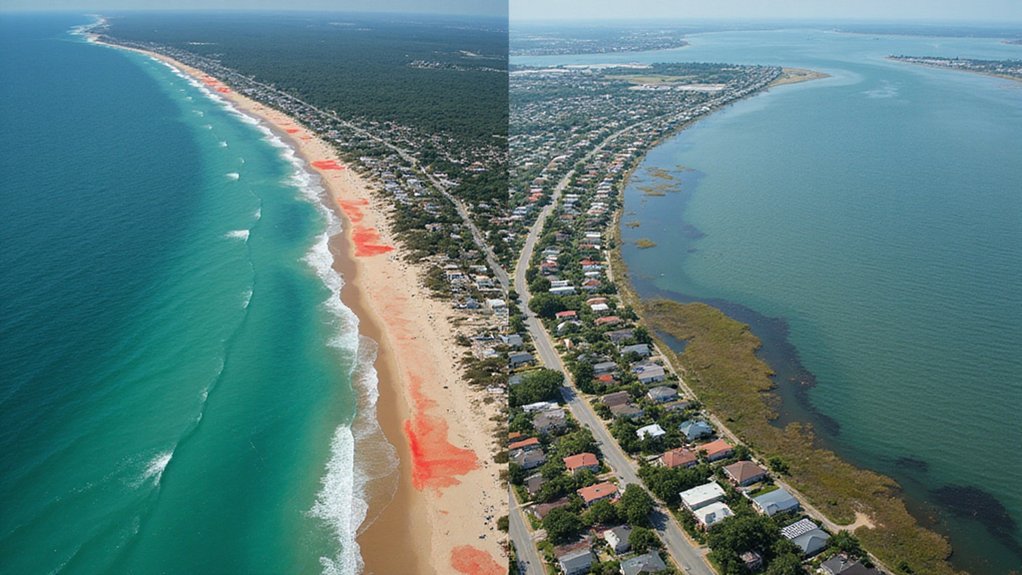
As sea levels rise faster than scientists predicted, America’s coastlines are being redrawn with alarming speed. Gulf Coast states like Texas and Louisiana are getting the worst of it. Their shorelines are disappearing faster than anyone thought possible.
Even the Southeast—places like South Carolina and Georgia—are watching water creep up their shores at rates that make old projections look laughably optimistic.
Weird thing is, the West Coast isn’t following the script. Despite dire warnings, sea levels there have remained relatively stable. Oops. Back to the drawing board for those models.
It’s not just about inches on a map. The average coastal city now deals with “sunny day flooding”—water in the streets when there isn’t even a storm. King tides plus regular sea level rise? Recipe for disaster. The gap between average sea level and dry land is shrinking, turning minor events into major headaches.
The 2024 sea level “report cards” covering 36 coastal regions make for grim reading. Scientists aren’t just tracking linear change anymore—they’re mapping acceleration. Because things aren’t just getting worse; they’re getting worse faster.
Climate Central’s Coastal Risk Finder shows which neighborhoods are toast by 2050. Not exactly bedtime reading.
Here’s the twist: 40% of Americans live in coastal counties. That’s a lot of people, businesses, and infrastructure sitting in harm’s way. Many coastal residents continue to view sea-level rise as a problem affecting others, not themselves. Just ask the Isle de Jean Charles Band of Biloxi-Chitimacha-Choctaw Tribe—they’ve already lost 98% of their land to rising waters and had to relocate inland.
Yet the “rebuild at all costs” mentality persists. Sure, why not throw good money after bad?
Communities are scrambling to adjust through land use planning and “smart growth” strategies. William & Mary’s interactive dashboards provide communities with 55 years of data to inform their adaptation efforts. But with hundreds of millions globally projected to be affected by 2100, we’re talking about unprecedented migration and economic strain. These changes are directly linked to extreme weather events becoming more frequent due to rising global temperatures.
The maps are being redrawn, and nobody likes what they’re seeing.
References
- https://www.epa.gov/climateimpacts/climate-change-impacts-coasts
- https://www.sciencedaily.com/releases/2025/05/250506135744.htm
- https://www.epa.gov/climate-indicators/climate-change-indicators-coastal-flooding
- https://climatecommunication.yale.edu/publications/sea-level-rise-maps-can-decrease-risk-perceptions-in-coastal-communities/
- https://www.climatecentral.org/climate-matters/new-us-coastal-risk-map-and-analysis
